·
•••Report content

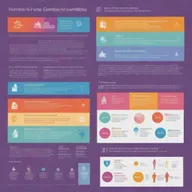
Exploring the Relationship Between State Medical Expenditure and Human Development Index | Infographic

b
@beadedsharpshoo1 creation ·

Discover the intriguing correlation between state medical expenditure and human development index (HDI) through captivating charts, graphs, and icons in this professionally designed infographic. Gain insights into healthcare spending, life expectancy, education, and income levels in an easily understandable format.

Remix this
Creations
1
Images
4
Model
turbo
Likes
0
  1. 1 / 1turbo1:1

    State Medical Expenditure and its impact on human development index

Related portraits

More like this from the community.

See all
An infographic illustrating the relationship between state medical expenditure and its impact on the human development index (HDI)
•••Report content
Design a clean, sophisticated infographic displaying FON Donations over the past six years (2018-2023) where values increase as per specific amounts provided, with a grand total displayed at the end.
•••Report content
Create a complex infographic visualizing poverty and inequality statistics in Pakistan, using charts, graphs, and symbols related to the economy
•••Report content
Create a clear infographic showing a linear relationship between the number of hours worked and the corresponding amount on the paycheck.
•••Report content
A visually engaging infographic illustrating the concept of Integral Geopolitics in relation to Oil and Gas Marketing
•••Report content
A detailed and vibrant infographic about economy, showcasing various aspects including graphs, charts, and icons representing finance, trade, and market trends
•••Report content
An infographic detailing the client journey at DiscoverYourJourneys travel agency, showcasing the steps from initial consultation, through custom itinerary planning, to the realization of a bespoke trip.
•••Report content
A visually engaging infographic on Business Statistics, featuring various charts such as pie charts, bar graphs, and line graphs
•••Report content
An infographic showing a student's journey from novice to expert, incorporating aspects of Experiential Learning Theory (ELT), symbolized by an unfolding spiral, and the Novice to Expert Theory, represented by increasing levels of skill. The end stage depicts the student proficiently handling emergency situations.
•••Report content
An infographic showcasing various elements of national income in the field of economics. Include bar graphs, pie charts, dollar bills, and population icon.
•••Report content
Visualize statistical decision theory as an infographic, showcasing different procedures for optimal decision-making under uncertainty.
•••Report content
A vibrant, informative poster showing the concept of supply in economics. It should feature graphs, money flows, everyday commodities, and transactions. The emphasis should be on the importance of supply dynamics in everyday life.
•••Report content
Annual statistics report for the rheumatology department 2024, showcasing detailed graphs and charts representing patient demographics, treatment outcomes, types of rheumatologic diseases treated, and overall patient satisfaction metrics
•••Report content
A comprehensive infographic examining the impact of Special Economic Zones (SEZ) in Indonesia, focusing on the sectors of agriculture, manufacturing, and tourism
•••Report content
YOUR CREATION. YOUR CHOICE.

Made by you.
Seen by who?

Before you create, choose who gets to see it.

Generation visibility
18+ only

Show mature content?

Mature mode shows adults who turn it on tasteful 18+ creations.