·
•••Report content

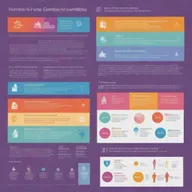
Understanding Clustering Algorithms: An Infographic Guide

D
@Dedy Hartama1 creation ·

Explore our vibrant infographic on clustering algorithms in data science featuring K-means, Hierarchical clustering, and DBSCAN. Discover how these methods work through clear flowcharts, colorful graphics, and real-world applications like market segmentation and image compression.

Remix this
Creations
1
Images
1
Model
hd
Likes
0
  1. 1 / 1hd1:1

    ALGORITMA CLUSTERING

Related landscapes

More like this from the community.

See all
A visually engaging representation of clustering analysis performed in R, showcasing a colorful scatter plot with distinct clusters marked by different colors and shapes
•••Report content
A detailed infographic illustrating various mathematical concepts using given data. The image should incorporate graphs, formulas, and symbols in a sophisticated and aesthetically pleasing manner.
•••Report content
A technical-themed complex graph incorporating specific information, with a well-detailed process scheme. Utilize vibrant colors to distinguish each separate process.
•••Report content
A detailed schematic representation of a digital population, incorporating research data. Each individual is denoted by a node, and their interconnections signify relationships, while varying node colors symbolize different research results.
•••Report content
A comprehensive and visually engaging infographic illustrating the concept of categorical data analysis
•••Report content
Infographic illustrating a comprehensive, efficient quality management system, displaying process flow and elements of planning, controlling, assurance, and improvement.
•••Report content
Create an informative and captivating poster representing different forms of societies, distinguished by their structures and norms, with color-coded sections and engaging visuals that represent each type of society.
•••Report content
A visually engaging one-page educational poster that showcases key concepts of computer science, featuring blockchain technology, machine learning with Python programming, and data structures
•••Report content
A complex graph including a detailed process scheme, designed with diverse and bright colors to help delineate each separate process.
•••Report content
A visually compelling image illustrating the intersection of process mining in business, data science, Dijkstra's and graph algorithms, machine learning, and neural networks
•••Report content
An intricate representation of a complex machine learning model, featuring interconnected nodes, layers and weights that symbolize the data processing and neural networking.
•••Report content
A visually engaging poster about algorithms, integrating various elements that explain key concepts such as sorting algorithms, search algorithms, and complexity analysis
•••Report content
Visualize statistical decision theory as an infographic, showcasing different procedures for optimal decision-making under uncertainty.
•••Report content
Create an impressive figure that combines elements of process mining, data science, Dijkstra's algorithm, graph algorithms, machine learning, and neural networks
•••Report content
A detailed infographic illustrating the spectrum of decision-making processes, showcasing various decision-making models and their applications in different fields such as business, psychology, and healthcare
•••Report content
A large, detailed schematic representing a digital population. Each individual is shown as a unique node with intricate connections, showing the complexity of their network.
•••Report content
YOUR CREATION. YOUR CHOICE.

Made by you.
Seen by who?

Before you create, choose who gets to see it.

Generation visibility
18+ only

Show mature content?

Mature mode shows adults who turn it on tasteful 18+ creations.