


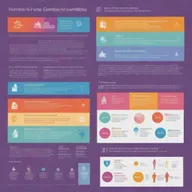
Digital Transformation Roadmap: Milestones, Timelines, and Strategic Initiatives
@hormonalcreeper1 creation ·
Discover a detailed roadmap for your organization's digital transformation journey, including essential milestones, timelines, and strategic initiatives. This visually engaging design incorporates elements such as cloud migration, data analytics, cybersecurity, and digital innovation. Explore how this clean and professional roadmap can guide and accelerate your organization's digital transformation efforts.
- Creations
- 1
- Images
- 4
- Model
- turbo
- Likes
- 0
- 1 / 1turbo1:1
digital transformation roadmap
Related landscapes
More like this from the community.

A detailed and colorful roadmap showing different stages of a project, with milestones, goals, and timelines

Create an image that visually represents 10 innovations that changed the world

Infographic illustrating a comprehensive, efficient quality management system, displaying process flow and elements of planning, controlling, assurance, and improvement.

A visual representation of a construction project timeline, highlighting the key phases of the project


A detailed project timeline tracing the stages of a large-scale construction project

Design an infographic showing the journey of a client at DiscoverYourJourneys travel agency, highlighting each step from initial meeting, tailor-made itinerary planning, to customized trip execution.

A graphic roadmap depicting the stages of AI ERP implementation, visually representing the journey with milestones for training, security implementation, and continuous monitoring and optimization

A simplified, vertical illustration representing the various processes carried out in operating systems, emphasizing streamlined flowcharts and process diagrams

Depict the interaction between different parts of an information system, highlighting data flows

Create a detailed and comprehensive visual representation of an application and data architecture

A detailed infographic displaying the key elements in market analysis such as target market, competition, market trends, and consumer behavior.


Visual representation of the future evolution of an information system incorporating elements of AI and IoT

A visually compelling infographic outlining strategies to build an education and training business aimed at achieving one billion revenue


An infographic summarizing the surrogacy process

A visual representation of progression in informatics, showing a timeline from early computing devices to modern-day technology


A visually engaging infographic that illustrates the concept of technological convergence, showcasing the integration of various media forms such as text, image, audio, and video


A visually engaging infographic that illustrates complex relationships and data connections


A detailed educational infographic on how to pick good quality stocks, featuring key strategies such as analyzing financial statements, understanding business models, assessing market position, evaluating management quality, and considering competitive advantages

Redesign the infographic to highlight the progression of the human understanding of gender and sexuality more clearly. Add a detailed timeline, clearer graphics, lucid data, and make use of contrasting colors for better readability.

An illustration depicting the improvement in informatics development over time

An infographic depicting common career paths, including roles such as doctor, engineer, teacher, artist, and entrepreneur

Show an intricate project management scenario where critical tasks, their dependencies, necessary resources, and timelines are being planned meticulously for optimal resource allocation.

Visualize statistical decision theory as an infographic, showcasing different procedures for optimal decision-making under uncertainty.