·
•••Report content

Boost Your Brand on Social Media with Impressive Growth in Followers, Engagement, and Reach

m
@marco1 creation ·

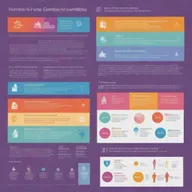
Discover the power of social media with our infographic showcasing the impressive growth in followers, engagement, and reach of your brand. Get inspired by rising lines and bar graphs in your brand's specific colors.

Remix this
Creations
1
Images
4
Model
turbo
Likes
0
  1. 1 / 1turbo

    Una gráfica con datos sobre el crecimiento de seguidores, engagement y alcance de una marca en redes sociales.

Related landscapes

More like this from the community.
See all
An informative and visually striking infographic on a neutral background. The infographic is filled with vibrant colors, neatly organized data graphics, icons, and small text descriptions.
•••Report content
Design a visually striking infographic with a balance of images, charts, and text. Let the colors be vibrant and the data represented in a clear and concise manner.
•••Report content
A detailed infographic displaying the key elements in market analysis such as target market, competition, market trends, and consumer behavior.
•••Report content
In a landscape format, illustrate a carefully detailed technical-themed bar chart demonstrating multiple processes in bright, assorted colors.
•••Report content
An infographic densely packed with eye-catching visuals and concise data, containing a wealth of information presented in an engaging manner. Features vibrant colors, bar graphs, pie charts, timelines and icons.
•••Report content
Create an intricate, visually appealing diagram template, incorporating a deep understanding of color theory with emphasis on brand identity. Use branded fonts to enhance the overall aura of the design.
•••Report content
An innovative and dynamic graphic layout representing an online marketing agency with elements like digital charts, SEO icons, and social media logos.
•••Report content
Design a clean, sophisticated infographic displaying FON Donations over the past six years (2018-2023) where values increase as per specific amounts provided, with a grand total displayed at the end.
•••Report content
A digital illustration of a graph on a sleek background, featuring a line graph that steadily hovers at 50% on the Y-axis, and then showing a sharp step function increase, sharply rising to 90% in a dramatic fashion
•••Report content
A visually engaging infographic on Business Statistics, featuring various charts such as pie charts, bar graphs, and line graphs
•••Report content
Create a clear infographic showing a linear relationship between the number of hours worked and the corresponding amount on the paycheck.
•••Report content
A dynamic business graph and chart concept featuring colorful data visualizations that showcase financial analysis
•••Report content
Create an educational infographic illustrating the relationship between 'Instructional Media', 'Instructional Aids', and 'Instructional Materials'. Include relevant icons, arrows, and labels to represent the overlap and interaction of these concepts.
•••Report content
A detailed and modern business report layout featuring stylish graphs and charts highlighting key performance indicators, financial statistics, market analysis, and growth projections
•••Report content
Infographic showing an intuitive and smooth user experience on a mobile app, designed for easy shopping and enhanced customer satisfaction
•••Report content
An expertly designed, captivating template for a medical-themed PowerPoint presentation integrating related medical graphics, icons, and infographics
•••Report content
An infographic showcasing various elements of national income in the field of economics. Include bar graphs, pie charts, dollar bills, and population icon.
•••Report content
YOUR CREATION. YOUR CHOICE.

Made by you.
Seen by who?

Before you create, choose who gets to see it.

Generation visibility
18+ only

Show mature content?

Mature mode shows adults who turn it on tasteful 18+ creations.