

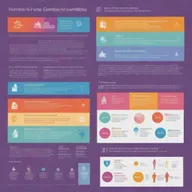
3 Essential Tips to Avoid Bias in Research: An Engaging Infographic
@persistent-quicksilver11 creation ·
Discover an informative infographic showcasing three key tips for avoiding bias in research and data presentation. Learn how to diversify data sources, acknowledge personal bias, and the importance of peer review with visually appealing graphics and clear bullet points.
- Creations
- 1
- Images
- 1
- Model
- hd-turbo
- Likes
- 0
- 1 / 1hd-turbo1:1
3 tips on how to avoid bias infographics
Related landscapes
More like this from the community.


A visually engaging infographic illustrating consumer rights


A thoughtful infographic exploring the ethics of AI in education


A visually compelling infographic outlining strategies to build an education and training business aimed at achieving one billion revenue


An educational infographic focusing on decision-making biases, specifically overconfidence bias, anchoring bias, confirmation bias, and availability bias


A visually appealing infographic showcasing effective communication strategies for personal interaction in the digital era


A visually engaging infographic illustrating consumer rights, featuring key elements such as the right to safety, the right to be informed, the right to choose, the right to be heard, and the right to redress

Visualize statistical decision theory as an infographic, showcasing different procedures for optimal decision-making under uncertainty.

A visually engaging infographic that illustrates complex relationships and data connections


An informative and visually striking infographic on a neutral background. The infographic is filled with vibrant colors, neatly organized data graphics, icons, and small text descriptions.

A visually appealing infographic showcasing the top 10 business ideas in 2023


Redesign the infographic to highlight the progression of the human understanding of gender and sexuality more clearly. Add a detailed timeline, clearer graphics, lucid data, and make use of contrasting colors for better readability.

A detailed educational infographic on how to pick good quality stocks, featuring key strategies such as analyzing financial statements, understanding business models, assessing market position, evaluating management quality, and considering competitive advantages


Create a detailed and colorful infographic with engaging visuals and easy-to-understand data or information.

A detailed and visually engaging infographic showcasing the key principles of management, including Planning, Organizing, Leading, and Controlling


An illustrated infographic detailing the consumer buying process


A detailed infographic showcasing various statistics, including bar charts, pie charts, and line graphs


Create an image that illustrates the basics of AI, focusing on small-sized English text

Create an infographic that explains 'The Power of the Mind'

A visually engaging infographic illustrating the various skills of communication, including verbal communication, non-verbal communication, active listening, public speaking, and effective writing


A visually engaging infographic representing the 3M Rule for Personal Finance and Stock Market, focusing on three key concepts: Mindset, Method, and Management


An informative and visually engaging infographic showcasing a list of various significant social theories from different sociological perspectives
