

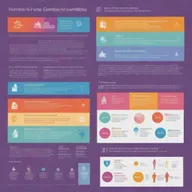
Stunning Infographic: Visualizing Data Connections with AI
@elegant-forest11 creation ·
Explore a beautifully designed infographic that showcases interconnected tables filled with demographics, sales figures, and regional comparisons. With vibrant colors, clear text, and creative icons, this engaging visual makes data easy to understand!
- Creations
- 1
- Images
- 1
- Model
- hd-turbo
- Likes
- 0
- 1 / 1hd-turbo1:1
connect this table
Related landscapes
More like this from the community.


An informative and visually striking infographic on a neutral background. The infographic is filled with vibrant colors, neatly organized data graphics, icons, and small text descriptions.

An infographic densely packed with eye-catching visuals and concise data, containing a wealth of information presented in an engaging manner. Features vibrant colors, bar graphs, pie charts, timelines and icons.

Design a visually striking infographic with a balance of images, charts, and text. Let the colors be vibrant and the data represented in a clear and concise manner.


Redesign the infographic to highlight the progression of the human understanding of gender and sexuality more clearly. Add a detailed timeline, clearer graphics, lucid data, and make use of contrasting colors for better readability.

A colorful, schematic representation of an English language lesson, with key words, phrases, and grammar structures arranged in an intuitive and engaging diagram.

A professional and sleek database design concept, visualizing a complex relational database schema


Create a detailed and colorful infographic with engaging visuals and easy-to-understand data or information.


A simplified, vertical illustration representing the various processes carried out in operating systems, emphasizing streamlined flowcharts and process diagrams

An illustrative representation showcasing the various processes performed within operating systems, complete with system layers, process flows, and user interfaces

A sleek, modern organizational chart design showcasing a hierarchical structure in a corporate setting


Create a detailed and comprehensive visual representation of an application and data architecture

Depict the interaction between different parts of an information system, highlighting data flows

A detailed infographic showcasing various statistics, including bar charts, pie charts, and line graphs


A visually engaging infographic that illustrates complex relationships and data connections


Create a mind map diagram portraying the stages of lifecycle for artifacts produced by the electronic industry, enriched with symbols and colors that represent each stage, from the design phase to disposal or recycling.

Create an intricate, visually appealing diagram template, incorporating a deep understanding of color theory with emphasis on brand identity. Use branded fonts to enhance the overall aura of the design.


A visually appealing graphic representing the structure of a website, showcasing elements such as HTML tags, CSS styles, and JavaScript interactivity


A visually appealing infographic design that features a mix of vibrant colors and clean layouts


A detailed and colorful roadmap showing different stages of a project, with milestones, goals, and timelines

Create a visually appealing poster featuring diverse technology devices symbolizing ICT (Information and Communication Technology) uses. It should include expressive info-graphics, bold colors, and modern fonts to depict the benefits and applications of ICT in day-to-day life.