·
•••Report content

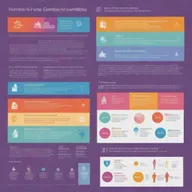
Comprehensive Gender Audit Report: Insights & Improvements

c
@creative-candle11 creation ·

Explore a detailed gender audit report featuring colorful charts, pay equity statistics, and key insights on gender equality within organizations. Discover recommendations and success stories that drive diversity and inclusion.

Remix this
Creations
1
Images
1
Model
hd-turbo
Likes
0
  1. 1 / 1hd-turbo2:3

    gender audit report

Related landscapes

More like this from the community.

See all
A detailed report for the personnel department of the Cultural Preservation Hall Region XIII for the year 2024
•••Report content
An infographic densely packed with eye-catching visuals and concise data, containing a wealth of information presented in an engaging manner. Features vibrant colors, bar graphs, pie charts, timelines and icons.
•••Report content
A detailed and visually appealing annual report design, featuring elegant typography, graphs, and charts showcasing financial performance, sustainability initiatives, and overall growth
•••Report content
A visually engaging report on teacher performance, featuring a clean layout with sections for statistics, achievements, and feedback
•••Report content
A detailed and visually engaging monograph on business management, featuring key concepts such as strategic planning, leadership, organizational behavior, financial management, and marketing strategies
•••Report content
Design a visually striking infographic with a balance of images, charts, and text. Let the colors be vibrant and the data represented in a clear and concise manner.
•••Report content
A detailed and professional report layout for the evaluation of the performance of county departments for the financial year 2023/24
•••Report content
A visually engaging infographic on Business Statistics, featuring various charts such as pie charts, bar graphs, and line graphs
•••Report content
A sleek BPM (Business Process Management) system module, accentuating configurable processes. It features improved ergonomics, editable editions appearing user-friendly, and exemplifies an optimized user experience. A visual representation of an innovative call for tender management tool.
•••Report content
A professional distribution proposal document, featuring a clean corporate layout, clear headings, bullet points outlining key components such as market analysis, distribution strategies, financial projections, and benefits
•••Report content
Design a clean, sophisticated infographic displaying FON Donations over the past six years (2018-2023) where values increase as per specific amounts provided, with a grand total displayed at the end.
•••Report content
A visually engaging and informative field attachment report for the year 2024, featuring sections on key highlights, objectives achieved, challenges faced, and future recommendations
•••Report content
A sleek and professional risk management presentation with graphs, charts, and data tables providing easy-to-understand visuals, all set in a corporate environment.
•••Report content
A detailed and modern business report layout featuring stylish graphs and charts highlighting key performance indicators, financial statistics, market analysis, and growth projections
•••Report content
YOUR CREATION. YOUR CHOICE.

Made by you.
Seen by who?

Before you create, choose who gets to see it.

Generation visibility
18+ only

Show mature content?

Mature mode shows adults who turn it on tasteful 18+ creations.