·
•••Report content

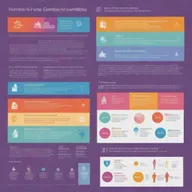
Mastering Categorical Data Analysis: A Visual Guide

w
@wondersue1 creation ·

Discover a comprehensive infographic on categorical data analysis, featuring key concepts, types of data, and analysis methods like Chi-square tests and bar charts. Enhance your understanding with colorful diagrams and clear labels in a modern, professional design.

Remix this
Creations
1
Images
1
Model
hd-turbo
Likes
0
  1. 1 / 1hd-turbo2:3

    categorical data analysis

Related landscapes

More like this from the community.

See all
A visually engaging infographic that illustrates the concept of technological convergence, showcasing the integration of various media forms such as text, image, audio, and video
•••Report content
A visually compelling infographic outlining strategies to build an education and training business aimed at achieving one billion revenue
•••Report content
A visually engaging infographic on Business Statistics, featuring various charts such as pie charts, bar graphs, and line graphs
•••Report content
A detailed infographic illustrating the spectrum of decision-making processes, showcasing various decision-making models and their applications in different fields such as business, psychology, and healthcare
•••Report content
A detailed educational infographic on how to pick good quality stocks, featuring key strategies such as analyzing financial statements, understanding business models, assessing market position, evaluating management quality, and considering competitive advantages
•••Report content
A detailed infographic-style illustration explaining key economic indicators and their significance in trading
•••Report content
A visually engaging and informative field attachment report for the year 2024, featuring sections on key highlights, objectives achieved, challenges faced, and future recommendations
•••Report content
Design a visually striking infographic with a balance of images, charts, and text. Let the colors be vibrant and the data represented in a clear and concise manner.
•••Report content
A creative and engaging design for a learning module that incorporates various educational elements
•••Report content
Design a clean, sophisticated infographic displaying FON Donations over the past six years (2018-2023) where values increase as per specific amounts provided, with a grand total displayed at the end.
•••Report content
An infographic densely packed with eye-catching visuals and concise data, containing a wealth of information presented in an engaging manner. Features vibrant colors, bar graphs, pie charts, timelines and icons.
•••Report content
A detailed and visually engaging infographic illustrating various financial mathematics concepts, including compound interest, annuities, amortization schedules, and present value calculations
•••Report content
Visualize statistical decision theory as an infographic, showcasing different procedures for optimal decision-making under uncertainty.
•••Report content
A visually striking and modern monthly statistical review report, featuring colorful graphs, charts, and infographics that display various data points clearly and concisely
•••Report content
An organized and visually engaging presentation of the OHADA accounting plan, showcasing a clear outline of its components such as the General Chart of Accounts (Plan Comptable Général), various accounting categories, and subcategories
•••Report content
YOUR CREATION. YOUR CHOICE.

Made by you.
Seen by who?

Before you create, choose who gets to see it.

Generation visibility
18+ only

Show mature content?

Mature mode shows adults who turn it on tasteful 18+ creations.